
Atmospheric Air Quality
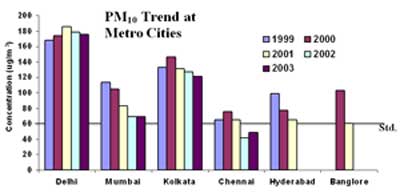
Table 5 : Comparison of PM10 Levels in Major Cites
| Delhi | Kolkata | Mumbai | Hyderabad | Chennai | |
| 255 | 196 | 142 | 69 | 73 | |
| 180 | 130 | 83 | 66 | 63 | |
| 75 (29%) |
66 (34%) |
59 (42%) |
3 (4%) |
10 (14%) |
* NAAQM Programme, NEERI, (Indrani Gupta and Rakesh Kumar, 2006)
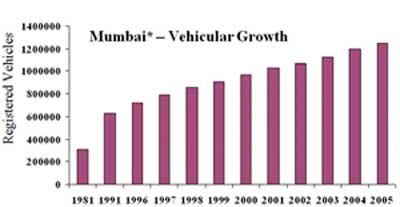
These values are registered vehicles : Real numbers on road are different
* Transport Commissioner Office, Mumbai
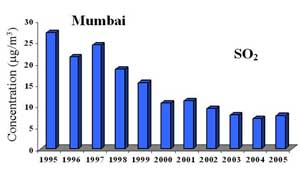
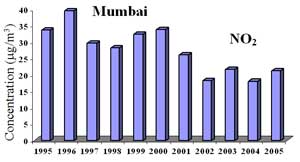
Figure 5 : Yearly Trend of SO2, NO2, PM10 and Registered Vehicles at Mumbai
Benefit Mapping for Mumbai Air Quality
The BenMAP (Benefit Mapping) Software developed for USEPA by Abt Associates is a tool, which aids in evaluating the economic impacts of air quality modifications. It has been applied for Mumbai city through joint activity between USEPA, MPCB and NEERI.The BenMap tool basically requires four inputs form users, viz. categorized population data, the disease incidence data for each population category, economic valuation of the disease incidences and the air quality values for each zone into which the region of interest has been divided. The tool uses the correlation between air pollutant concentration and the disease prevalence (concentration-response) and extrapolates it to the entire population based on the actual/ expected air quality scenario. The economic values associated with the health impacts i.e. medical resources, wage loss, etc are then determined for the region of interest.
Air quality information at three locations viz. Worli, Parel, Kalbadevi, under National Ambient Air Quality Monitoring Programme (NAAQM) was used. Additional locations at Maravali, Khar and Borivali were added which are monitored under local area monitoring programme. Based on these monitored data, the year 2000 was taken as baseline. It was noted that air quality intervention policies such as introduction of CNG, low sulfur fuel, Bharat (Euro equivalent) standards were implemented during the period of 2000 to 2003. These control policies were considered as control scenario for the year 2004. Year 2004 air quality for PM10 was used to compare the improvement from the baseline of 2000 to estimate economic benefits for health.
BenMap use with limited data for three years (2001-2003) indicates enormous health benefits if air pollution levels particularly, if PM10 is brought down to the national standard. Using the CR functions developed in Asian countries, which are similar to Indian conditions, one gets a fairly good idea about the health benefits and their corresponding monetary benefits. The estimated annual benefits of attaining 60 g/m3 for the period 2001-2003 leads to a decrease in death in the range of 2500 to 4800 based on the dose response equations. The decrease in hospital admission is about 1700. A significant decrease in lower respiratory disease like cough will be about 23 million. On the other hand the estimated decrease in upper respiratory disease will be 301 million for adults (i.e. age group 18-100).
In monetary terms fixed and random effect estimates based on Health Effects Institutes impact functions, estimated benefits are 722 and 859 million Indian rupees. Using (Ostro, 1989 and 2006), the estimated benefit is 1386 million Indian Rupees. In all these estimates, economic values are from Srivastava and Kumar, 2002. Estimated total benefits of meeting the CPCB Standard of 60 ug/m3 PM10 is 798 million Indian rupees averaged over 3 years (2001-2003) for avoiding mortality using the concentration response function as estimated by Cropper et al. 1997. When these values are computed using US purchasing power parity, the benefit estimates range between 34-72 billion Indian Rupees.
Health benefit estimates are being looked at as an integral method of policy intervention for air pollution reduction leading to improved health. BenMap use with limited data for three years indicate enormous health benefits if air pollution levels particularly of PM10 is brought down to the national level. Though C-R functions, typical of India are not available, use of studies give fairly good idea about the range of monetary benefits, which can be derived. Use of this technique for other pollutants as well as for morbidity will provide a good tool for implementation policies for air pollution reduction.