Population
The GMR is one of the largest metropolises of the world with its population of 99,25,891 in 1991, approximately 12 million with a population density of 19,758 persons per square km in 2001 to estimated 23,710 per square km in 2011(NEERI 2004). With increase in population there has been and will be increased number of vehicles and industrial activity aggravating air pollution.Transportation
The main roads are congested most of the day. There are approximately 80000 vehicles on road per million of population. Maximum traffic flow (Annual Average Daily Traffic, AADT) at a road section was about 1,20,000 vehicles per day in 1995. Municipal and commercial activities are concentrated in the city’s southern part. Commuting to and from populated areas to the south places a large burden on the road system. The capacity of the road and rail system to accommodate the increasing need for south-north commuting is too small, leading to chronic daytime congestion. There was an increase of approximately 150% in number of vehicles in year 2001 as compared to year 1996.Industry
Mumbai is India’s financial and commercial center and is the most industrialized city. About 40,000 small and big industries function in the city with about 32 being classified as hazardous. Industries like textile mills, chemical, pharmaceutical, engineering and foundry units are largely responsible for industrial air pollution. They are located mainly in the eastern and northeastern corridor of the region concentrated in Parel, Worli, Chembur, and Sion and along LBS Marg from Kanjur Marg to Mulund. Process and fuel emissions constitute main source. Major air pollution sources include a giant fertilizer/chemical complex; two oil refineries and a thermal power plant. There are about 183 air polluting industries in GMR out of which 70 are large-scale, 37 are medium and 76 are small scale. In addition there are stone crushers and query in Kandivali, Chandivli, Dahisar and Powai area. About 2800 bakeries in the city emit almost 92 % of the particulate matter emission. About 64 crematoria, two incinerators, households and hotels along with building constructions are contributing to the particulate matter emission in descending order.Ambient air Quality
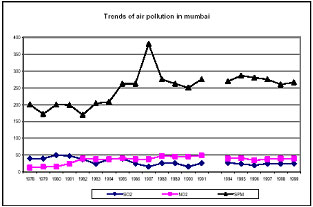
Municipal Corporation of Greater Mumbai (MCGB) is the primer institution monitoring air quality since 1076-77. Air Quality Monitoring and Research Laboratories, Mumbai (AQMRL) are the major custodians for data on air quality. Some of the other institutions monitoring air quality are Maharashtra State Pollution Control Board (MPCB), Bhabha Atomic Research Center (BARC), National Environmental Engineering Research Institute Zonal laboratory (NEERI), and some agencies associated with Mumbai Metropolitan Region Development Authority (MMRDA). The extent and depth of data collection has varied in years as political, bureaucratic, scientific, social and economical regime change within the city. Although we can see a sharp rise in population, in the number vehicles, commercial and industrial activity along with major infrastructural changes in road transport, developmental activity, the data suggest that the ambient air quality is more or less the same in last decade or so. Fig 2 to 6.
Figure : 2 Trends of Air Pollution, Mumbai, 1978-99
On the one hand that could be credited to the policy and regulatory interventions. With the adoption of a fuel change regime and planned phase out of high lead and sulfur containing fuel from the public transport system and cleaner fuels for industry made available.
Yearly Trend Of SO2 - NO2 (Mumbai)


These Values are registered Vehicles : Real numbers on road are different.
Figure : 3 Decreasing values of SO2 & NO2 with increasing number of vehicles in Mumbai.
However the values of SO2, NO2 and Suspended Particulate Matter (SPM) were almost always high sometimes two to three fold then the prescribed levelsby World Health Organization WHO) or NAAQB. On the other hand more fuel efficient motor engines have been increasingly adopted by the markets there by reducing per vehicular load of pollution. It may also be that the data collected is flawed.
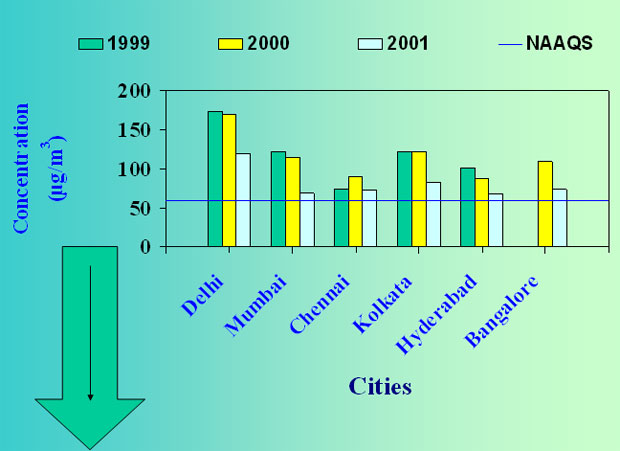
RSPM ( RESIDENTIAL AREAS)

Figure : 4 Decreasing values of Respirable suspended particulate matter in residential areas over years in major cities of India
